Welcome back to the Bear Den, a blog for players looking to get into competitive FFTCG. We’ve been diving deep into deck theory with the latest set reveals and thoroughly enjoying Limit Break. What a breath of fresh air the mechanic has brought to the game.
The extra 8 cards go a long way in helping decks cover their bad matchups and truly make the game more fast-paced with less downtime. I hope your experiences have been as fun as mine. So, let’s take a break from deck testing and theory to address a question I’ve seen come up more and more in the community over the past year.
How many copies of a card should I run in this deck? A question asked by most competitive players, ever 🙂
This is a question that’s been asked since the dawn of FFTCG and card games in general. However, with the recent addition of cards like Warrior of Light and Curilla, FFTCG players have to ponder more than they ever have before. How many three drops can I get away with? Can I run fewer Knights to cover my late-game weaknesses? How many Moogles do I need to make Good King Moogle Mog work? (Spoiler: more than what we have… Can I get a good Moogle Forward, please?)
All of these questions are somewhat subjective because, at the end of the day, it’s all about risk/reward. However, for those who love numbers, there are ways to maximize our efforts when building a deck. The concept is known as a Hypergeometric Calculator, and that is the topic of today’s article. So, without further ado, let’s dive in.
What are Hypergeometric Calculations?
Strictly speaking, Hypergeometric calculators are an implementation of a Hypergeometric Distribution model in statistics. The definition of a hypergeometric distribution is:
In probability theory and statistics, the hypergeometric distribution is a discrete probability distribution that describes the probability of 𝑘
Hypergeometric distribution – Wikipediasuccesses (random draws for which the object drawn has a specified feature) in 𝑛
draws, without replacement, from a finite population of size 𝑁
that contains exactly 𝐾
objects with that feature, wherein each draw is either a success or a failure. In contrast, the binomial distribution describes the probability of 𝑘
Now, in card player terms, you can simply understand it as this: based on a random event (draw/X reveal/etc.), what is the likelihood I will see a certain card(s) per event. Further simplified, you could say ‘how likely am I to whiff on an effect?’ As you know, there is no worse feeling than whiffing on a reveal effect with the dreaded reveal top 5 curse. And truthfully, outside of 50 valid targets, there is always a chance for that to happen and there isn’t anything we can do about that unfortunately. At the end of the day, the math can’t be changed, only manipulated in your favor to the best of our ability. Keep that in mind as you read because I hold no responsibility when you whiff a WoL7 trigger in top cut, even though you had a 96% chance to hit the card(s) you needed. Sometimes, bad luck just happens and as a card player, you have to come to terms with that immutable fact.
Now, let’s take a look at how the math works at a very high level and see how we can apply it to FFTCG. To accomplish this, we are strictly going to look at the inputs and outputs of a calculator. I am NOT, repeat NOT, going to dive math theory on hypergeometric distributions. Besides the fact that everyone would just gloss over it (or just close out entirely), I don’t think the theory is of much value. Not to mention, I can’t explain the proof anyways. At the end of the day, it calculates occurrences in random events that have X successes and that is all we need to know.
Hyper Geometric Calculator
A hyper geometric calculator is simply a tool that defines a basic set of inputs and gives us defined outputs. To use one, you don’t need to know the theory, how the proof works, or even be that good at math. You simply need to know how to use the calculator and some basic probability skills.
A calculator consists of the following inputs
| Property | Description |
|---|---|
| Population Size | Total # of items in a give set (ie Deck). |
| Successes in Population | Total # of valid targets in the given set (3 drops or Knights) |
| Sample Size | Total size for the given subset (reveal 5 or draw 1) |
| Successes in a Sample (X) | Total # of valid targets in the given subset (ie 3 drops or Knights). This is commonly known as “X” |
Now, let’s break down each property in more detail and give some basic examples.
Population Size
Population Size represents the total number of options within the given set. This almost always manifests as “cards in the deck” for our purposes. At the start of the game, this is going to be 50. If you are performing a calculation from a “midgame” situation, you may want to use 30 or so, with late game around 15.
Successes in Population
This is meant at the total # of a valid target within a given set. Cards like WoL 7 requiring 3 drops or 7CP Lezaford requiring Wind characters of 5 or less, are good examples. This is the number you will manipulate in your statistics since it is the only one you have some control over in your deck building.
Sample Size
Sample Size is the number that represents the subset (partial) targets of the population size. Some examples are reveal top 5, draw 5 cards, and look at top 3.
Success in Sample Size
This represents the number you WANT to see in the sample size. Taking WoL7 as the example again, he states, ” reveal top 7, select up to 2 3 CP characters and play to the field. In this case, the # of successes are 2 since we are looking for 2 successes in the sample size.
Now, let’s take a look at the outputs of the calculator
| Output | Description |
|---|---|
| X=x | Probability of exactly getting your target X |
| X <= x | Probability of less than or equal to your wanted targets |
| X >= x | Probability of greater than or equal to your wanted targets |
| X > x | Probability of greater than to your wanted targets |
| X < x | Probability of less than to your wanted targets |
The above chances are fairly self-explanatory in nature and will be explained more in the first example. However, I will note here that X >= x is by far the most used metric. We usually want to see “At least 1” in most sets. We simply don’t care if there are more than 1 in most circumstances. However, other numbers are important, so I always recommend generating the stats as a set. How often am I not going to see a card or condition is just as important in certain calculations.
Some math you need to know
I wanted to mention this before I get into the examples. When you are calculating scenarios using the calculator, there are often times where you need to combine multiple outputs from the calculator to fully calculate your chances. This holds true in both examples below so I thought it would be a good idea to discuss this now.
When you have two events that are mutually exclusive and you want to know the success (or failure) of depending on the outcome of both, you can use the following easy formula to calculate the outcome. Don’t worry, I will break this down into more simply terms.
PCHANCE = 1 – (P1 * P2)
With the following definitions of each variable:
PChance is the outcome of the combined events.
P1 – Probably you DID NOT see your desired outcome from result #1
P2 – Probably you DID NOT see your desired outcome from result #2
The hardest part about this equation is understanding that the results you are looking for are based on your chance of NOT seeing the outcome you want. This is slightly different compared to when you are looking at the chances of an event happening. Once multiplied together, we have a value that represents our combined chances to not see our desired outcome. That means we can simply subtract it from 1 to see the chances for our desired outcome.
If you are having trouble following, don’t worry. We will put it to practical use in the examples and hopefully make it clear.
Example #1: Opening Hands

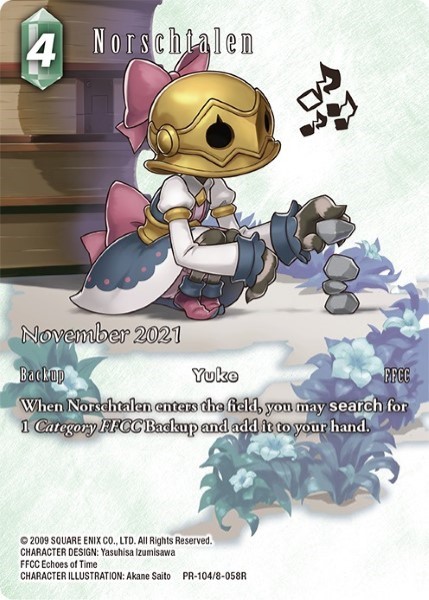
The mulligan is one of the most tried and true scenarios to use a Hyper Geometric Calculator. When you draw your first 5 (6/7) cards, you hope to see certain cards in your opening hand. Cards like Norschtalen, Emina, and Sara (FFL) are great examples. Now, when you draw cards in FFTCG, you can mulligan your hand to the bottom of your deck in any order and draw 5 more cards. So, let’s take a look at the following scenario:
Classic Case
Deck: 50 Cards, 16 Backups, 25 Forwards, and 9 Summons.
So, with this scenario in play, let’s ask some questions, run those questions through the geometric calculator, and analyze the results:
Question #1 – How likely am I to see at least 1 backup in my opening hand?
| Input | Value | Reasoning |
|---|---|---|
| Population Size | 50 | All cards exist in the deck which totals 50 |
| Total # of Success in Population | 16 | There are 16 total backups in the deck |
| Sample Size | 5 | FFTCG opens by drawing 5 cards to hand |
| Successes in Sample | 1 | We are looking for 1 backup. |
After plugging it into the Hyper Geometric Calculator, let’s take a look at the results:
| Output | Value | Description |
|---|---|---|
| X=x | 35% | Chances for exactly 1 backup |
| X <= x | 48% | Chances for 1 or less backups |
| X >= x | 86% | Chances to 1 or more backups |
| X > x | 52% | Chances for more than 1 backup |
| X < x | 13% | Chances for no backups |
Right out of the gate, we can quick see that our chances to have “At Least 1” backup in our opening hand are 86%. This means that if we played 100 games, we would see a backups in 86 of them on average. However, in card game terms, 86% isn’t that high and is often a bit of a trap area for consistency. While there no written rule on exactly how much chance to take, I go with anything over 92%. Luckily, the game gives us a mechanism to increase our odds.
Question #2: What if I mulligan?
Now, let’s say you missed and did NOT get a backup in your opening hand and decide to mulligan. We can use the calculator again to determine what our new odds are now that we know the bottom 5 cards are NOT backups. That means the top 45 cards contain all 16 backups. This allows us to decrease the population size, increasing our chances to see backups in the top 5 cards of our deck.
| Input | Value | Reasoning |
|---|---|---|
| Population Size | 45 | We check 45 cards since we can guarantee the bottom 5 cards of the deck are NOT a backup. |
| Total # of Success in Population | 16 | There are 16 total backups in the deck |
| Sample Size | 5 | FFTCG opens by drawing 5 cards to hand |
| Successes in Sample | 1 | We are looking for 1 backup. |
Now, let’s take a look at the results:
| Output | Value | Description |
|---|---|---|
| X=x | 31% | Chance to see exactly one backup |
| X <= x | 41% | Chances to see 1 or less backups |
| X >= x | 90% | Chance to see 1 or more backups |
| X > x | 59% | Chance to see greater at least 2 backups |
| X < x | 10% | Chance to see no backups |
As we can see, our percentage increased after the mulligan since our population decreased by 5. We simply have better chances when we know that all of our backups are in a smaller card pool. Additionally, you will get either 1 or 2 additional cards on your first draw. This pushes this percentage even higher. With a mulligan, we are now able to calculate the likely hood of seeing a single backup with a mulligan in our opening hand.
As we discussed in our equation above, you can combine these outputs to get a single percentage for seeing at least one backup in our opening hand.
1 – (.13 * .1) = 98.7%
We have a whopping 98.7% chance to see at least 1 backup in our opening hand if we include our mulligan. These are much better odds compared to our chances without the mulligan and really allow us to rely on seeing a single backup in our opening hand across a large number of games.
It really goes to show just how powerful and forgiving the mulligan is in FFTCG.
Before we drive into the next example, take a moment to try this out yourself. Try it with 14 backups. 18 backups. 6 backups. Pay special attention to the difference between our result at 16 vs the others. You can then start to ask yourself: Where does the value on return diminish? How little can I get way with? You can really start to put together some concrete thoughts.
The answer to the questions is at the bottom of the article so you can check for yourself.
Example #2: Why backups that search backups are so good
If you have been playing FFTCG for any period of time, you have undoubtedly heard about how strong backups searching backups (called backup searchers for the sake of this article) are in the game. It never fails that I have to explain to new players why they are so good and why MOST decks should have at least one set. This is especially true for players new to the competitive scene that don’t have a card game background. It is a difficult concept to understand if you are more focused on “slay the opponent” then win the game. Building on our previous example, lets analyze the theory that backups that search backups, is valid.
We learned in Example 1 that with a mulligan, we have over a 90% chance to see at least one backup with 16 in our deck. However, in more modern FFTCG, a 16-backup deck can be a liability in the late game since it opens us up to dead draws more often.
Dead draws are turns where you need cards to play but draw cards you cannot play such as redundant names or backups after you have 5 in play
Clearly, we don’t want to see this happen so our natural inclination is to drop the number of backups in our deck. However, we also need to see those early in the game, especially if our deck is dependent on a strong late game economy. Thus, we are presented with a damned if you do, damned if you don’t type of problem. So, we need a solution that maintains our consistency and allows us a stronger late game.
Now, it is no secret I am referring to backup searchers since that is the whole point. I am simply stating why we care at all from a game perspective to make the concept more concrete. After all, the goal is to apply these concepts to our deck building to increase the power and consistency of our decks. Aka…Win More Games.
For backup searchers, it is important to start from a universal assumption and work our way out from this concept. Backup searchers represent TWO backups in our deck instead of one. Let me explain.
When you start a game with an opening hand with a single backup, you are only guaranteed that backup in the moment. You are not guaranteed to draw another next turn or even the turn after. A backup searcher flips that on its head and guarantees a 2nd backup when you decide you want to one. It is an incredibly strong absolute in a game where anything is but absolute.
To begin to solve the puzzle we are going to have to answer to completely separate questions first, then combine those answers together into a final number.
- What are the odds of seeing less than 2 backups in our opening hand?
- What are the odds of seeing 0 searcher backups in our opening hand?
Let’s use the following backup line in a 50-card deck as our example:

Let’s start with question #1 which is almost exactly like our first example except we are looking for at least 2 backups.
| Input | Value | Reasoning |
|---|---|---|
| Population Size | 50 | 50 Cards in Deck |
| Total # of Success in Population | 16 | There are 16 total backups in the deck |
| Sample Size | 5 | FFTCG opens by drawing 5 cards to hand |
| Successes in Sample | 2 | We are looking for 2 backup. |
And our results:
| Output | Value | Description |
|---|---|---|
| X=x | 33% | Chance to see exactly 2 backups |
| X <= x | 82% | Chance to see 0, 1, 2 backups |
| X >= x | 52% | Chance to see 2 or more backups |
| X > x | 18% | Chance to see more than 2 backups |
| X < x | 48% | Chance to see less than 2 backups |
As you can see, our current chances to get less than 2 backups is 48%. That approximately translates to every other game we play. I don’t know about you, but those odds do not translate very well for me. If my game plan relies on curving out quickly, the last thing I want are inconsistent games across 7/8 rounds of Swiss. Even worse, this doesn’t take into consideration about drawing the SAME backup twice, making matters worse. You just can’t take a deck with these odds and expect to do well consistently to a major event if backups are part of the gameplan.
Now, we need to take a slightly different approach in our next calculation. We need to see our chances for seeing 1 of our 6 backup searchers in our opening hand. Then, we can use this number in conjunction with our previous calculation to see how likely we are to see at least 2 backups turn 1.
So, let’s finish up our basic calculations by calculating our chances to NOT see at least 1 searcher backup in our opening hand.
| Input | Value | Reasoning |
|---|---|---|
| Population Size | 50 | 50 Cards in Deck |
| Total # of Success in Population | 6 | There are 6 total searcher backups in the deck |
| Sample Size | 5 | FFTCG opens by drawing 5 cards to hand |
| Successes in Sample | 1 | We are looking for 1 searcher. |
And our results:
| Output | Value | Description |
|---|---|---|
| X=x | 38% | Chance to see exactly 1 searcher |
| X <= x | 89% | Chance to see 0 or 1 searchers |
| X >= x | 49% | Chance to see 1 or more searchers |
| X > x | 10% | Chance to see more than 1 searchers |
| X < x | 51% | Chance to see less than 1 searchers |
Now that we have both scenarios of missing two backups, we can put it all together to get our chances of seeing less than two backups in our opening hand. Since we are looking at the chances of failures across two mutually exclusive events, we can use our equation from before and plug these numbers right in
.49 * .51 = .24 (24%)
This means that if we have a 24% chance to NOT see 2 backups, we can quickly calculate the chances to see AT LEAST 2 backups
1 – .24 = .76 (76%)
Now, with just adding backup searchers, we have pushed our chances out to a much more acceptable 76%. That is much better than the 51% we calculated earlier. Now, this isn’t even the best part, because we are not done. We still have our mulligan!
Let’s run the calculations one more time, this time in combination with a mulligan. Just like before, we need to execute 2 calculations: one for the scenario of 2 backups and 1 for the scenario of 1 searcher.
| Input | Value | Reasoning |
|---|---|---|
| Population Size | 45 | We check 45 cards since we can guarantee the bottom 5 cards of the deck are NOT a backup. |
| Total # of Success in Population | 16 | There are 16 total backups in the deck |
| Sample Size | 5 | FFTCG opens by drawing 5 cards to hand |
| Successes in Sample | 2 | We are looking for 1 backup. |
and results
| Output | Value | Description |
|---|---|---|
| X=x | 36% | Chance to see exactly 2 searcher |
| X <= x | 77% | Chance to see 0, 1, 2 searchers |
| X >= x | 59% | Chance to see 2 or more searchers |
| X > x | 23% | Chance to see more than 2 searchers |
| X < x | 41% | Chance to see less than 2 searchers |
Finally, we can run one last geometric calculation to get the final piece:
| Input | Value | Reasoning |
|---|---|---|
| Population Size | 45 | We check 45 cards since we can guarantee the bottom 5 cards of the deck are NOT a backup. |
| Total # of Success in Population | 6 | There are 6 total searchers in the deck |
| Sample Size | 5 | FFTCG opens by drawing 5 cards to hand |
| Successes in Sample | 1 | We are looking for 1 backup. |
| Output | Value | Description |
|---|---|---|
| X=x | 40% | Chance to see exactly 2 searcher |
| X <= x | 88% | Chance to see 0, 1, 2 searchers |
| X >= x | 53% | Chance to see 2 or more searchers |
| X > x | 12% | Chance to see more than 2 searchers |
| X < x | 47% | Chance to see less than 2 searchers |
We finally have everything we need to fully calculate out our chances for 2 backups. Our final math is as follows:
P1 * P2 * P3 * P4 = PTWO_BACKUPS
.48 * .51 * .41 * .47 = .046 (4.7%)
This means in our final step, we are looking at
Total Chance to See 2 Backups = 1 – PTWO_BACKUPS
95.3%
With all of that hard work, we finally have our chances to see at least two backups and see how searcher backups impact our chances. I don’t know about you, but I will take that all day long. This means we only have an ~1/20 chance to NOT see two backups in our opening hand. That is much better odds and really shows the power of backups that search backups. With better odds, comes better consistency across games and a more predictable outcome for your game plan. Additionally, it allows us to be greedier with our backup count and potentially lower the # we need to effectively curve out. Did you happen to notice how close in percentage we were to our “at least one backup” calculation from earlier. That was 98.7%. We are a mere 3.4% less but now we are seeing 2 backups. That is an insane consistency jump and all we did was run the same number of backups with 6 searchers.
Other Considerations
What we have discussed here today is really the basics of how to get into the world of min/maxing your deck through statistics. These are great base cases and good ones to study and run through on each deck you build. Since we all just hate aggro ;), I know you will be playing those 2 backups as early as possible. Well, this is probably just me and a bit of wishful thinking.
However, these calculations are not the end of the story. Just in the two examples we talked about, there are other considerations and things we did not discuss that you have to take into account. Some of those questions are:
- In our 2 backups use case, what are the likely hood I get two backups in my opening hand AND they are unique?
- In our 2 backups use case, what are the likely hood of getting 2 backups with each of a different element (ice/wind)
- What is the likely hood we get backups 3 and 4 AFTER our opening two backups?
There are a lot more considerations that we must take into account when working through our deck and quite frankly, we can’t test them all. Keep that in mind when you are using the tool and remember that it is only one piece of the puzzle.
Take Away
All card games are based on random events, and nothing can change that. However, learning how to use a hyper geometric calculator gives you a competitive edge. Whether it is crafting our opening hand or maximizing the likely hood our combo will pop off every game, the hyper geometric calculator helps demystify the chances. This is especially true in larger tournaments where your deck must execute consistently across many rounds. We have only scratched the surface and I encourage you to take the time to learn how to use the calculator to your benefit.
Well, that is all for me. I hoped you enjoyed the article and I look forward to seeing your newly optimized decks in the future.
Until then…….I return to my den of hibernation.
Appendix A – Answers
Here is a table and chart that represents the chances of seeing at least 1 backup.